Here is the most common misconception about EV charging networks: that the network with the most charging ports is the best one to rely on. Port count is a marketing figure. What actually determines your experience on a road trip — or on a Tuesday when your battery is at 12% — is whether the charger works when you pull up to it. Those are two very different things, and the gap between them is wider than most EV buyers realize before they drive off the lot.
The Charging Session That Goes Wrong: Why Network Choice Matters More Than You Think
Picture a realistic scenario: you're 280 miles into a 400-mile drive. You planned your stop around an EVgo station with three stalls shown as available in the app. You pull in, plug in — and the touchscreen is frozen. You move to the next stall. Error message. The third stall works, but only after two failed payment attempts. You've lost 15 minutes and a meaningful amount of range anxiety you didn't need.
This is not an edge case. According to Consumer Reports data cited by InsideEVs, EVgo had problems in 43% of charging sessions — meaning nearly half the time a driver pulls up to an EVgo station, something goes wrong. The same data shows that 76% of all reported charging issues across every network involved dead touchscreens or cryptic error messages. Broken hardware and failed payment systems are the dominant failure modes, not rare anomalies.
Tesla Superchargers, by contrast, recorded a 4% problem rate in the same Consumer Reports analysis. That gap — 4% versus 43% — is not a minor product difference. It is the difference between a charging network you can plan a trip around and one that requires a backup plan every time you use it.
The question worth asking before you commit to a charging strategy isn't "which network has the most locations?" It's "which network will actually work when I arrive?" This article answers that question using published reliability data, pricing structure analysis, and coverage metrics — not brand marketing claims.
How We Evaluated These Networks: The Metrics That Actually Predict Your Experience
Five dimensions shape how useful a charging network actually is in practice: reliability rate, network size and geographic coverage, pricing structure, accessibility for non-brand vehicles, and home charging integration. Of these, reliability carries the most weight — a charger you can't count on is worse than no charger at all, because at least with no charger you know to plan differently.
Port count, the figure networks lead with in their marketing, tells you almost nothing about usability. A network with 10,000 ports running at a 43% failure rate delivers fewer functional charging sessions than a smaller network running at 4%. The metric that matters is uptime — the percentage of sessions that complete without a significant problem.
Pricing structure also matters more than the headline rate. Two dominant billing models exist: per-kWh billing (used by Tesla, ChargePoint, and Electrify America) and per-minute billing (used by EVgo). Per-kWh billing charges you for the energy you actually receive, regardless of how fast your vehicle accepts it. Per-minute billing rewards vehicles with high charge acceptance rates and penalizes slower-charging ones. According to TrendX Insights, at per-minute networks, a vehicle accepting 50 kW pays roughly double the effective per-kWh rate of one accepting 100 kW. If you drive an older EV or one with a lower maximum charge rate, per-minute billing costs you significantly more for the same amount of energy.
Research from the Harvard Business School Institute for Business in Global Society found that public EV charging stations are reliable approximately 78% of the time overall — meaning roughly one in five public charging sessions involves some kind of problem. That baseline makes Tesla's 4% failure rate even more striking, and it frames the entire reliability conversation.
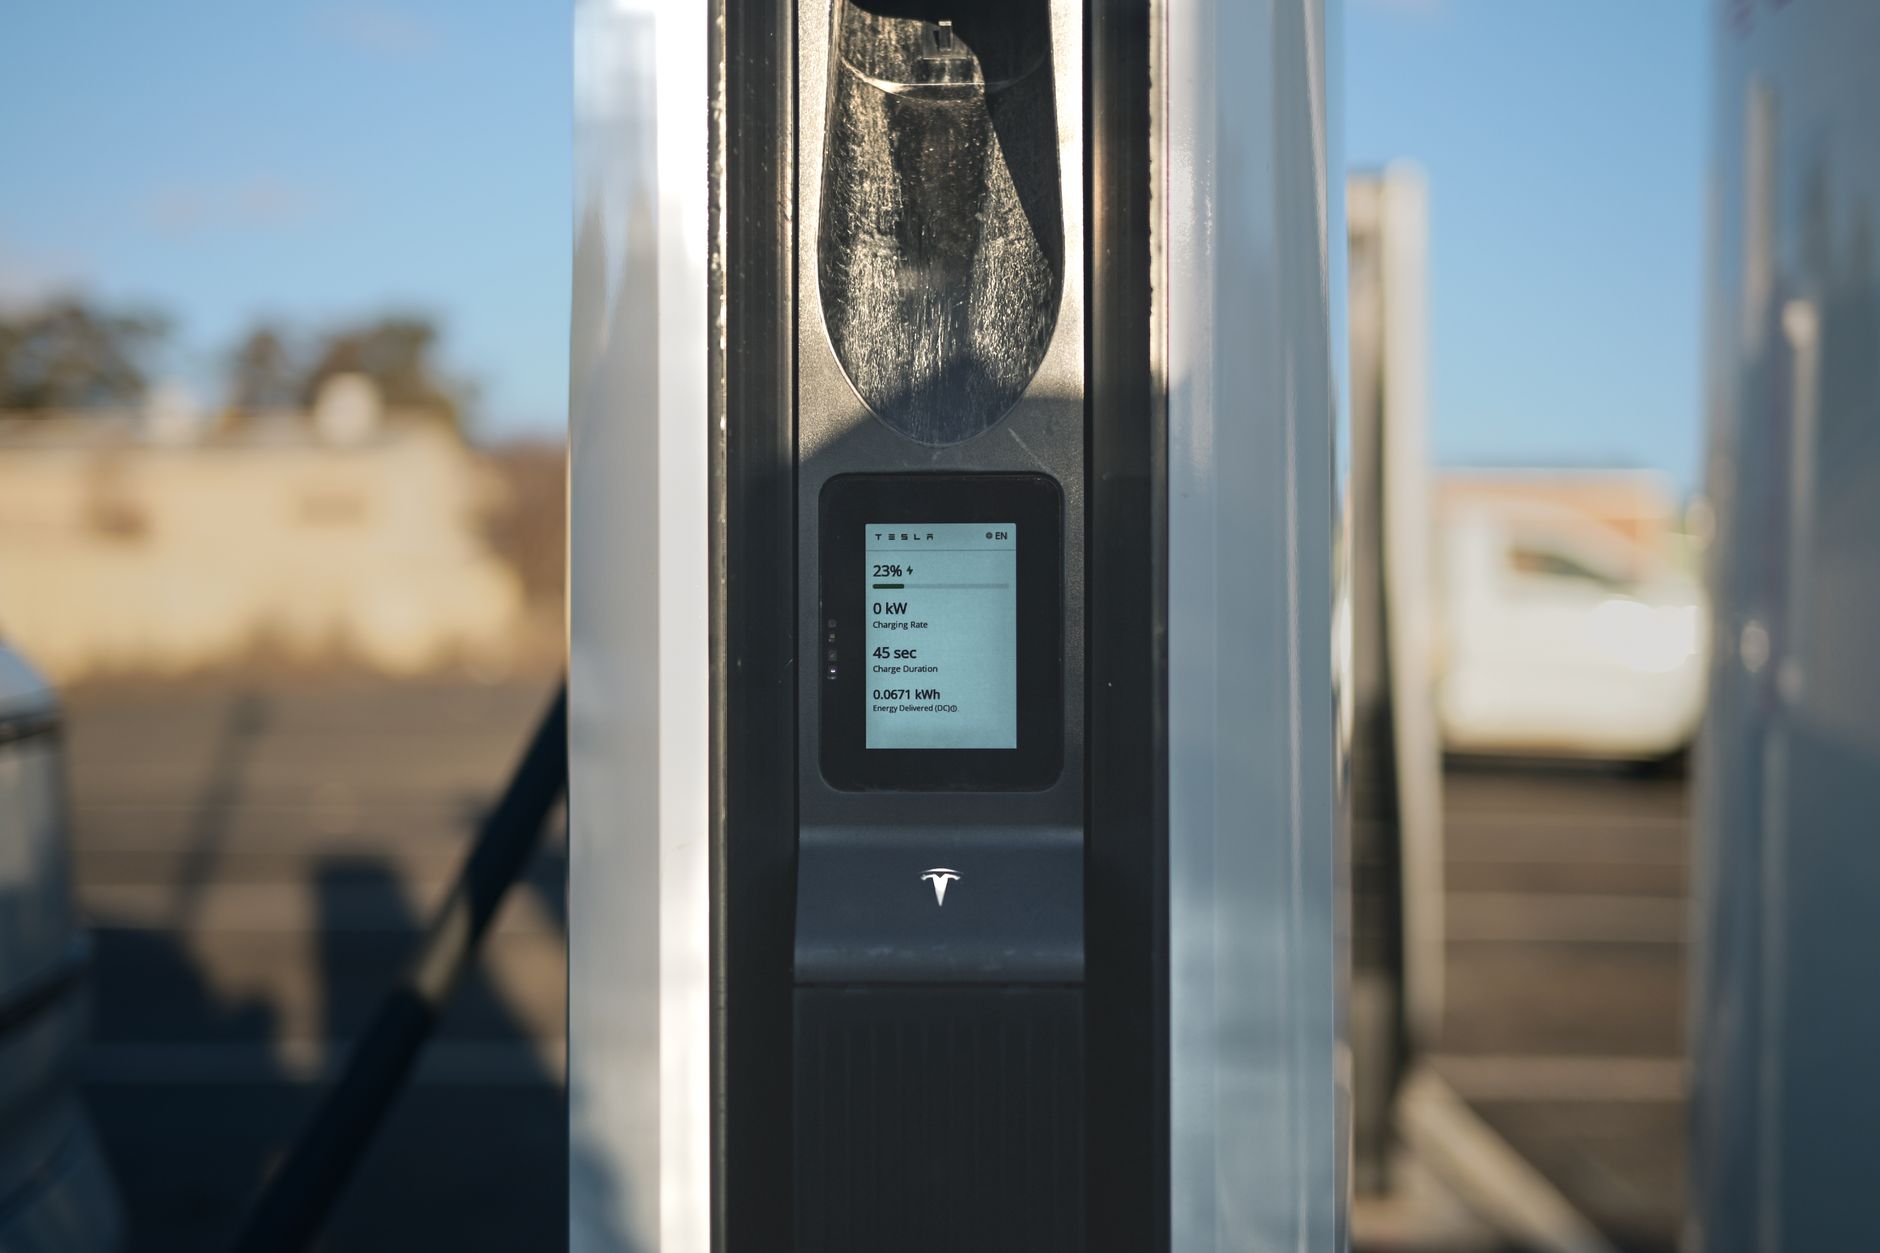
Tesla Supercharger Network: The Reliability Benchmark Every Other Network Is Measured Against

Tesla operates the largest DC fast charging network in the United States by port count, according to TrendX Insights. For years that network was exclusive to Tesla vehicles, which gave the company full control over the hardware-software integration that makes reliability possible. That exclusivity is now gone — the Supercharger network is open to all EVs via the NACS connector or an adapter — but the reliability advantage has held.
The 4% problem rate reported by Consumer Reports and cited by InsideEVs is the strongest reliability figure of any major public fast charging network. The only network that comes close is the Rivian Adventure Network at 5%, which remains restricted to Rivian vehicles. For drivers of any EV brand who need a public fast charger they can depend on, Tesla Supercharger is the current benchmark.
Non-Tesla drivers can access the network without a monthly fee, but the per-kWh rate is higher without membership. TrendX Insights reports that non-Tesla drivers pay ?.99 per month for a discount of approximately ?.10 per kWh. Whether that membership pays off depends entirely on how often you use the Supercharger network — if you charge primarily at home and only use public fast charging on occasional road trips, the math may not favor the subscription.
Pricing is largely consistent across the country, but TrendX Insights identifies Alaska, Hawaii, California, Colorado, and Connecticut as states with elevated Tesla Supercharger rates. Alaska and Hawaii carry the highest costs on every network due to geographic isolation and limited grid interconnection — those elevated utility costs flow directly into charging prices regardless of which network you use.
The Supercharger network's primary limitation is coverage pattern. Tesla built its network around highway corridors and major metro areas, which is excellent for road trips but leaves gaps in rural regions and smaller cities where other networks have invested more. If most of your driving is in a rural area or a mid-sized market, Supercharger density may be thinner than the total port count suggests.
ChargePoint: The Network Built for Everyday Drivers, Not Just Road Trippers

ChargePoint operates differently from Tesla and EVgo. Rather than focusing primarily on highway fast charging, ChargePoint has built a mixed network of Level 2 and DC fast chargers concentrated in workplaces, retail destinations, and multi-family residential properties. This positioning makes ChargePoint less useful for road trips and more useful for the 80% of charging that happens during the hours a vehicle sits parked anyway.
On reliability, ChargePoint's 24% problem rate — per Consumer Reports data cited by InsideEVs — is significantly better than EVgo, Shell Recharge, and Blink. It still falls well short of Tesla's 4%, but in the context of the broader market, ChargePoint sits in the upper tier of non-Tesla networks. FLO matches ChargePoint at 24%, and every other major network except Rivian and Tesla performs worse.
ChargePoint's home charging product strengthens its overall value proposition considerably. The ChargePoint Home Flex was ranked the top Level 2 home charger for 2026 by EnergySage, which evaluated it as the best balance of features, reliability, and value among all home chargers tested. EnergySage specifically noted that differences in charging speed, smart features, cable length, and installation requirements have a significant impact on day-to-day experience — and the Home Flex leads on most of those dimensions.
The ChargePoint app is a genuine differentiator. Testing by Car and Driver found it offers the most nuanced cost tracking of any home charger app, allowing drivers to select from dozens of local utility rate plans to calculate the actual cost of each charging session down to the penny — even on variable-rate electricity plans. The app also supports scheduled charging to take advantage of off-peak electricity rates, which can meaningfully reduce home charging costs over time.
ChargePoint's workplace presence is substantial. According to ChargePoint, its network serves 64% of Fortune 500 companies and 82% of Fortune 50 companies for workplace charging. For drivers whose employers have ChargePoint stations in the parking structure, the network effectively provides free or low-cost mid-day charging that eliminates most public fast charging needs entirely.
ChargePoint uses per-kWh billing at its DC fast chargers, which is the fairer structure for drivers whose vehicles have varying charge acceptance rates. You pay for the energy you receive, not the time you're plugged in.
EVgo: Fast Charging Ambition vs. a Reliability Problem That Still Needs Solving
EVgo's strategy is clear: dense urban and suburban DC fast charging, positioned near grocery stores, shopping centers, and other destinations where drivers already spend time. The location logic is sound. The execution has not matched the ambition.
A 43% problem rate, per Consumer Reports data cited by InsideEVs, means that if you use EVgo regularly, problems are not occasional — they are a near-daily expectation for frequent users. The dominant failure modes are the same ones plaguing the broader industry: dead touchscreens, payment system failures, and error messages that give the driver no actionable information. At 43%, EVgo sits among the worst-performing major networks, ahead of only Shell Recharge (48%), Blink (41%), and AmpUp (38%) in the Consumer Reports rankings.
EVgo's billing model adds a cost disadvantage for many drivers. The per-minute pricing structure means that a vehicle accepting 50 kW pays roughly double the effective per-kWh rate of a vehicle accepting 100 kW, according to TrendX Insights. Drivers of older EVs or vehicles with lower maximum DC charge rates are systematically overcharged relative to what they receive. Only drivers with vehicles that accept very high charge rates — 150 kW or above — get close to fair value from per-minute billing.
EVgo has been investing in infrastructure upgrades and AI-driven monitoring tools, and Q4 2024 metrics referenced by analyst Loren McDonald on LinkedIn showed utilization and throughput growth. The business is scaling. But scaling a network with a 43% problem rate means more drivers encountering broken chargers, not fewer — until the underlying reliability issues are resolved at the hardware and software level.
The honest use case for EVgo in 2026: urban drivers whose vehicles accept high charge rates, who have no home charging option, and who live in a city where EVgo has invested in newer-generation hardware. In that narrow scenario, the location convenience may outweigh the reliability risk. For most other drivers, the failure rate makes EVgo a backup option rather than a primary network.
The Full Reliability Scorecard: Where Every Major Network Stands in 2026

The Consumer Reports data cited by InsideEVs provides the most comprehensive public reliability ranking available. Here is the full picture:
| Charging Network | % of Sessions with Problems |
|---|---|
| Shell Recharge | 48% |
| EVgo | 43% |
| Blink | 41% |
| AmpUp | 38% |
| Electrify America | 35% |
| Volta | 33% |
| EV Connect | 31% |
| ChargePoint | 24% |
| FLO | 24% |
| Rivian Adventure Network | 5% |
| Tesla Supercharger | 4% |
To make these numbers concrete: a driver who uses EVgo five times per week would statistically encounter a problem more than twice per week. A driver using Tesla Superchargers at the same frequency would encounter a problem roughly once every five weeks. That difference compounds significantly over a year of regular use.
Rivian's 5% problem rate is notable and deserves acknowledgment — it nearly matches Tesla's reliability. The critical limitation is that the Rivian Adventure Network is restricted to Rivian vehicles, making it irrelevant for the majority of EV drivers. FLO at 24% matches ChargePoint and is worth considering for drivers in regions where FLO has strong coverage, particularly in Canada and the northeastern United States.
The Harvard Business School research finding that public charging is reliable approximately 78% of the time provides important context: even the industry average means roughly one in five sessions has some issue. Tesla's 4% rate is not just better than competitors — it is dramatically better than the industry baseline that most drivers have come to accept as normal.
What drives these reliability gaps? Hardware quality and maintenance investment are the primary factors. Networks that own and operate their own hardware — and that have the financial resources to maintain it proactively — consistently outperform networks that rely on third-party hardware or that have deferred maintenance investment. Payment system architecture is also a significant variable: networks that have modernized their payment processing have fewer of the touchscreen and transaction failures that account for the majority of reported problems.
Pricing Decoded: What You Actually Pay Per Mile on Each Network

Headline rates are rarely what you actually pay. The billing model, your vehicle's charge acceptance rate, your state, and whether you hold a membership all affect the real cost per session.
Per-kWh billing — used by Tesla, ChargePoint, and Electrify America — charges you for the energy delivered. The rate is the same regardless of your vehicle; only the total session duration varies based on how fast your car charges. This is the fairer model and the more predictable one for trip planning. Per-minute billing, used by EVgo, charges for time connected to the charger. As TrendX Insights explains, at per-minute networks, a vehicle accepting 50 kW pays roughly double the effective per-kWh rate of one accepting 100 kW. If your vehicle's maximum DC charge rate is below 100 kW, per-minute billing is working against you.
Geographic variation is real and significant. Alaska and Hawaii carry the highest EV charging rates on every network, driven by geographic isolation and limited grid interconnection that push commercial electricity costs well above the national average, according to TrendX Insights. Those elevated input costs flow directly into charging prices at every station in both states, regardless of which network operates them. Within the contiguous 48 states, California, Colorado, and Connecticut also see elevated Tesla Supercharger rates.
For Tesla's non-Tesla membership, the math is straightforward: ?.99 per month buys approximately ?.10 per kWh in savings. If you charge enough kWh per month at Superchargers to exceed ?.99 in savings, the membership pays for itself. For occasional road-trippers who use Superchargers a few times per year, the membership likely does not make financial sense.
Home Level 2 charging remains dramatically cheaper than any public fast charging option for daily use. The ChargePoint Home Flex, ranked number one by EnergySage, combined with off-peak electricity scheduling through the ChargePoint app, gives home chargers access to the lowest possible per-kWh rates available. For drivers who can install a home charger, the economics strongly favor maximizing home charging and treating public networks as supplemental.
Coverage Gaps and the State-by-State Reality: Where Each Network Leaves You Stranded

Raw port count obscures more than it reveals about coverage. The metric that actually predicts your experience is ports per 100 registered EVs — how many charging options exist relative to the number of vehicles competing for them.
New Jersey illustrates the gap between EV adoption and infrastructure investment. According to the 2026 EV Charging Report: State-by-State Breakdown, New Jersey has approximately 174,000 registered electric vehicles but only around 7,000 DC fast charge ports — a ratio of 3.4 ports per 100 EVs. That is a state that has absorbed a large EV population without a proportional infrastructure build, and drivers there feel the strain during peak travel periods.
Texas tells a different story. EV adoption has been accelerating, and charger investment has followed — the same report notes a flood of charger installations coming to the state, driven partly by Tesla's North American manufacturing presence and partly by broader network expansion. Texas is a near-term improvement story, though current coverage in rural parts of the state remains thin.
New York has active programs filling infrastructure gaps, including Evolve New York, which has been adding port count in areas previously underserved by major networks. The state is moving in the right direction, though urban density in New York City creates its own access challenges.
Rural coverage is the consistent weak point for all non-Tesla networks. Tesla's corridor-first build strategy gives it a meaningful advantage for long-distance interstate travel — Supercharger stations along major highways are spaced to accommodate the range of most current EVs. ChargePoint's strength in workplace and destination charging means its coverage is dense in urban and suburban commercial areas but thins out quickly on rural routes. EVgo's urban focus means it offers almost no coverage outside metropolitan areas.
The practical implication: if you live in a major metro and charge primarily at home or at work, ChargePoint's network density may serve you well. If you take regular long-distance road trips, Tesla Supercharger coverage along highway corridors is the most reliable infrastructure available. If you live in a rural area or frequently drive through one, identify your backup charging options before you need them — no network has solved rural coverage comprehensively.
Final Recommendation: Matching the Right Network to Your Driving Pattern
No single network is the right answer for every driver. The decision depends on three variables: how you charge most often, how far you drive, and what vehicle you own.
If you own a Tesla: The Supercharger network's 4% failure rate and national highway coverage make it your primary fast charging resource. Use it for road trips. Charge at home for daily use. The membership fee for non-Tesla drivers doesn't apply to you.
If you own a non-Tesla EV and take regular road trips: Tesla Supercharger should be your primary public fast charging network. Get the NACS adapter if your vehicle uses CCS, evaluate whether the ?.99 monthly membership pays off based on your usage frequency, and treat ChargePoint as your destination and workplace charging layer.
If you charge primarily at home and work: The ChargePoint Home Flex is the strongest home Level 2 charger for 2026 per EnergySage, and ChargePoint's workplace network gives you a consistent public charging layer without depending on DC fast chargers for daily needs. Use Tesla Supercharger for the occasional road trip.
If you live in an urban area without home charging: This is the hardest scenario. EVgo's urban density makes it geographically convenient, but a 43% problem rate means you need a backup plan every time. Prioritize stations with newer hardware, keep ChargePoint and Tesla Supercharger apps installed as alternatives, and always arrive with enough range to reach a second location if your first choice fails.
If your vehicle has a lower maximum DC charge rate: Avoid per-minute billing networks like EVgo. The effective per-kWh cost at a per-minute network roughly doubles for a vehicle charging at 50 kW compared to one charging at 100 kW,